label_size = 15
title_size = 20
legend_size = 13
handle_length = 1.5
fig, (ax1,ax2,ax3) = plt.subplots(1,3,figsize=(18,5))
ax = ax1
ax.tick_params(axis = 'x',which='both',length=5,direction='in', pad=10)
ax.tick_params(axis = 'y',which='both',length=5,direction='in', pad=5)
ax.xaxis.set_ticks_position('both')
ax.yaxis.set_ticks_position('both')
plt.setp(ax.get_yticklabels(), rotation='horizontal', fontsize=label_size)
plt.setp(ax.get_xticklabels(), fontsize=label_size)
ax.grid( visible=True, which="both", alpha=0.2, linestyle='--')
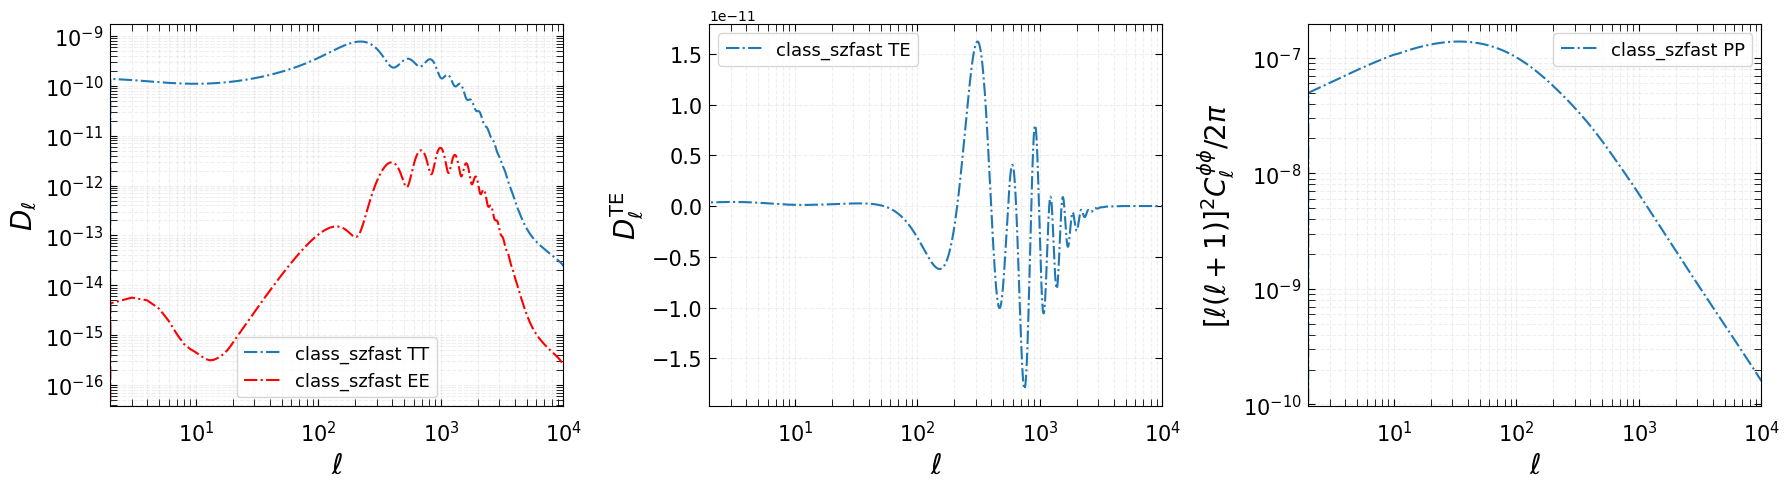
ax.plot(l_fast,l_to_dl(l_fast)*cl_tt_fast,ls='-.',label='class_szfast TT')
ax.plot(l_fast,l_to_dl(l_fast)*cl_ee_fast,ls='-.',c='red',label='class_szfast EE')
ax.set_ylabel(r"$D_\ell$",size=title_size)
ax.set_xlabel(r"$\ell$",size=title_size)
ax.set_xscale('log')
ax.set_yscale('log')
ax.set_xlim(2,1e4)
ax.legend(fontsize=legend_size)
ax = ax2
ax.tick_params(axis = 'x',which='both',length=5,direction='in', pad=10)
ax.tick_params(axis = 'y',which='both',length=5,direction='in', pad=5)
ax.xaxis.set_ticks_position('both')
ax.yaxis.set_ticks_position('both')
plt.setp(ax.get_yticklabels(), rotation='horizontal', fontsize=label_size)
plt.setp(ax.get_xticklabels(), fontsize=label_size)
ax.grid( visible=True, which="both", alpha=0.2, linestyle='--')
ax.plot(l_fast,l_to_dl(l_fast)*cl_te_fast,ls='-.',label='class_szfast TE')
ax.set_ylabel(r"$D_\ell^\mathrm{TE}$",size=title_size)
ax.set_xlabel(r"$\ell$",size=title_size)
ax.set_xscale('log')
ax.set_xlim(2,1e4)
ax.legend(fontsize=legend_size)
ax = ax3
ax.tick_params(axis = 'x',which='both',length=5,direction='in', pad=10)
ax.tick_params(axis = 'y',which='both',length=5,direction='in', pad=5)
ax.xaxis.set_ticks_position('both')
ax.yaxis.set_ticks_position('both')
plt.setp(ax.get_yticklabels(), rotation='horizontal', fontsize=label_size)
plt.setp(ax.get_xticklabels(), fontsize=label_size)
ax.grid( visible=True, which="both", alpha=0.2, linestyle='--')
ax.plot(l_fast,l_to_dl(l_fast)*cl_pp_fast*(l_fast*(l_fast+1.)),ls='-.',label='class_szfast PP')
ax.set_ylabel(r"$[\ell(\ell+1)]^2 C_\ell^{\phi\phi}/2\pi$",size=title_size)
ax.set_xlabel(r"$\ell$",size=title_size)
ax.set_xscale('log')
ax.set_yscale('log')
ax.set_xlim(2,1e4)
ax.legend(fontsize=legend_size)
fig.tight_layout()